
Table of Contents
- Purpose
- Why use the Unified Process (UP)
- Creating a Schedule
- Making a Priority Chart
- Creating a Requirements Document
- Creating a Noun Table
- Determining Event Types
- Activity Diagrams
- Database Issues
- Implementation Model vs. Workflow Diagrams
Purpose
This document was originally written for the CS432 class I was teaching at Regis University. The book we were using was Arlow/Neustadt‘s book UML2 and the Unified Process Practical Object-Oriented Analysis and Design (2nd-Edition).
The purpose of this document is to help you better understand the concepts being taught in the class. If you have a question, please e-mail me and I will try to answer it here in this document.
Why use the Unified Process (UP)
Why use the UP instead of some other Analysis and Design Tool?
The answer is divided into two sections, a brief history and the actual answer.
A Brief History
There are many different tools from which you may choose. Many are quite good and some date back to the time of FORTRAN and LISP, two of the first higher level languages created (in the early and late 1950s respectively). Edward Yourdon was one of the pioneers in the area of Structured Analysis and Design in the 1970s (as a sad side note, Ed Yourdon passed away on 20 January 2016). He was a good author and has embraced the OOAD paradigm and has created a methodology with Peter Coad based on the UML process. He has also worked with Tom DeMarco and project management concepts. The better approaches all are deliverable oriented instead of task oriented.
Answer
The Unified Process creates deliverable based on task focused activities. Some approaches emphasized the tasks you needed to complete instead of the items you needed to deliver. Whatever your focus is, that will be what you do the best. If your process is task focused, then the tasks you do will be great but the results will not necessarily be satisfactory.
Creating a Schedule
I haven’t gone through all the assignments up to the end of class, so I wasn’t sure what to do with the schedule piece other than knowing when it started and when I need to finish. Is there a better way to decide the time-table?
Please remember that the scheduling is for the entire project, including implementation. The Analysis and Design needs to be fairly complete on the last day of class. You can use the assignments as a starting point for your schedule. You need to decide what the project team needs to do to complete the project and create a schedule based on this. If you are using the UP phase guidelines (Satzinger: page 85, Figure 3-2) you should be completing the Elaboration Phase at the end of the course. The schedule should appear something like:
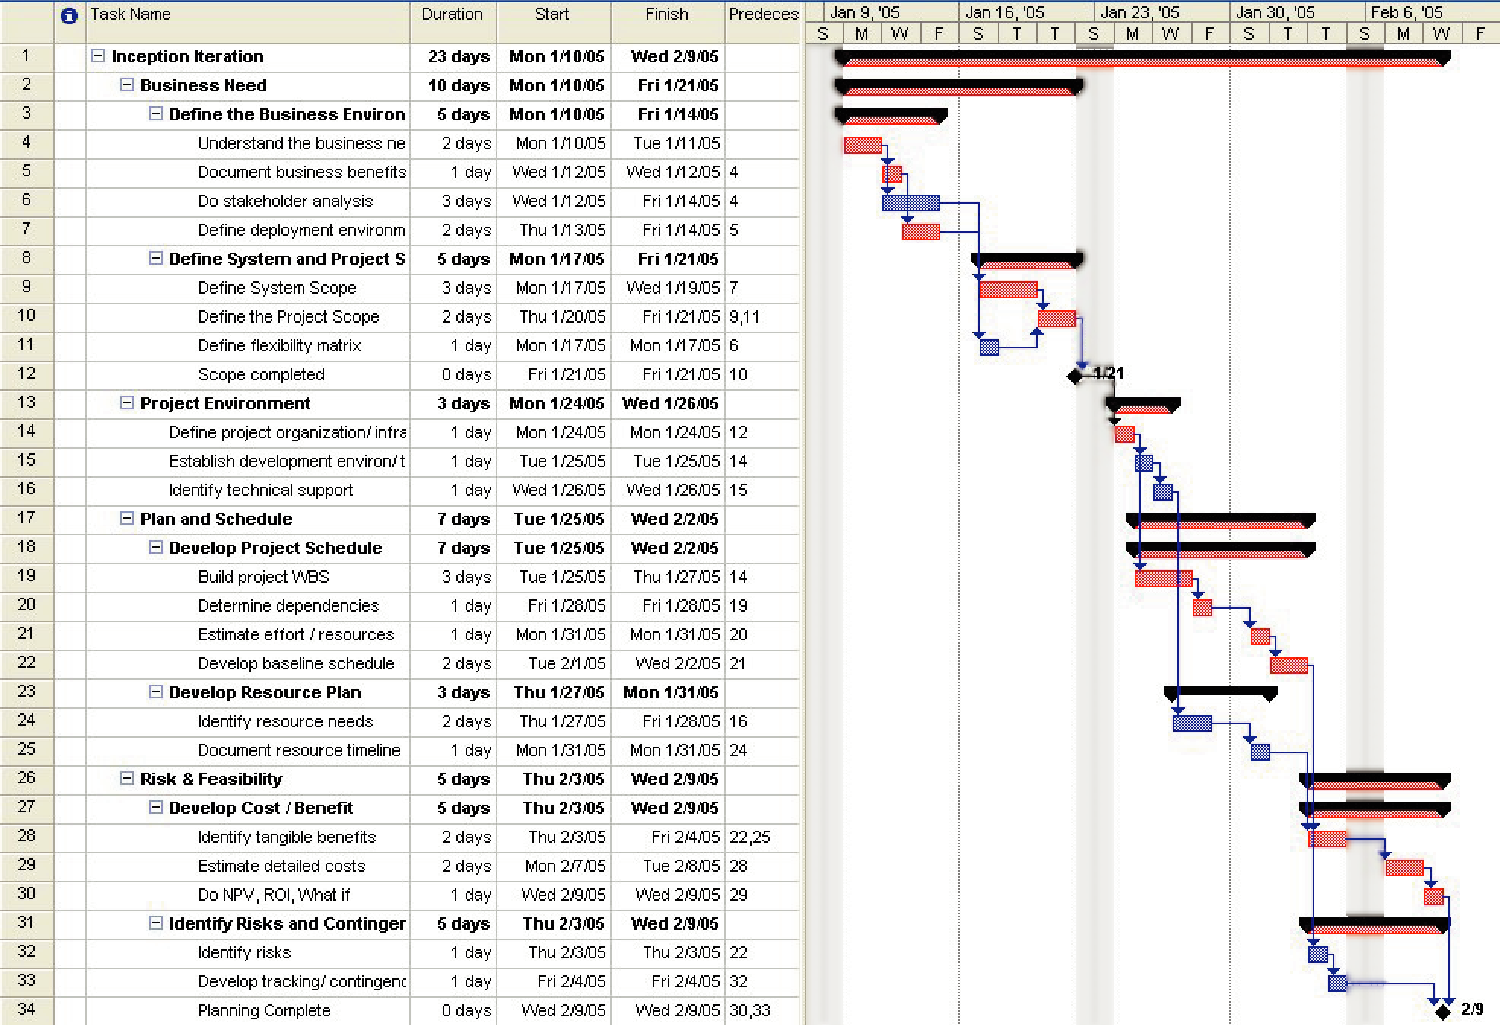
Process Flow Diagram with critical path noted
Making a Priority Chart
How do I create a Priority Chart? What exactly is a Priority Chart?
- Create a Priority chart that prioritizes schedule, resources, and cost of the project. There should be one entry in each row and each column so that only one has the highest priority, etc.
| Priority | High | Medium | Low |
| Schedule | |||
| Resources | |||
| Cost |
What needs to be done is decide which of Resources, Schedule, and Cost is the most important, which is the second most important and which is least important. Sometimes Cost is lumped in with Resources and that line is replaced by Scope. Whichever of these is more appropriate for your project is fine. An example of this diagram might be:
- Assuming that your schedule is fixed and cannot be changed, then the schedule would be the most important.
- If you have only one to two people to work on your project, with occasional help and input from others and you are a little more flexible on how much the project will cost, then your priority chart would be:
| Priority | High | Medium | Low |
| Schedule |
X |
||
| Resources |
X |
||
| Cost |
X |
If you chose the priority chart with scope (what the features of the project will be) and lump the cost into the resources category, then with the following priorities, you would have the following chart:
- Assume you do not need to finish this project until sometime after the class is finished (poor assumption for the design portion of the project for this class, but this is just an example.
- Assume you can have only two people working on the project and each person can only use the computer equipment already assigned to them. No more money will be allowed for any purpose.
- Assume you need to have a certain minimal features (scope) in the product, but you have a contingent list of features available if you are ahead of schedule.
The priority chart would look like:
| Priority | High | Medium | Low |
| Schedule |
X |
||
| Resources |
X |
||
| Scope |
X |
Please notice that you can one and only one X in each column and in each row. Each X must be in an unique row/column combination.
Creating a Requirements Document
What is the purpose of a Requirements Document How do I find out what the requirements are?
The simplest way to describe a Requirements Document is to say it is what is needed to best perform the task(s) that must be performed. Please note that what is wanted is only a part of fully understanding the requirements. Too often, if you just listen to what the shareholders want, then you will miss what they really need. A good example of how to continually work the requirements is the opening description in Chapter 11 of Satzinger. The first manager of the project did not thoroughly understand what the users of the system truly needed to accomplish their tasks. The second manager spent more time understanding how the various members of the team did their tasks and realized how important the interface was to accomplish the needed tasks. The bulk of the Requirements Document may be done early in the process, but it is never completed until the project is completed. As you go through the phases of the project, you will better understand what is needed and will improve the Requirements Document. This will help you produce a better final product.
Look at the Unified Process Life Cycle Model in the two texts we have in class:
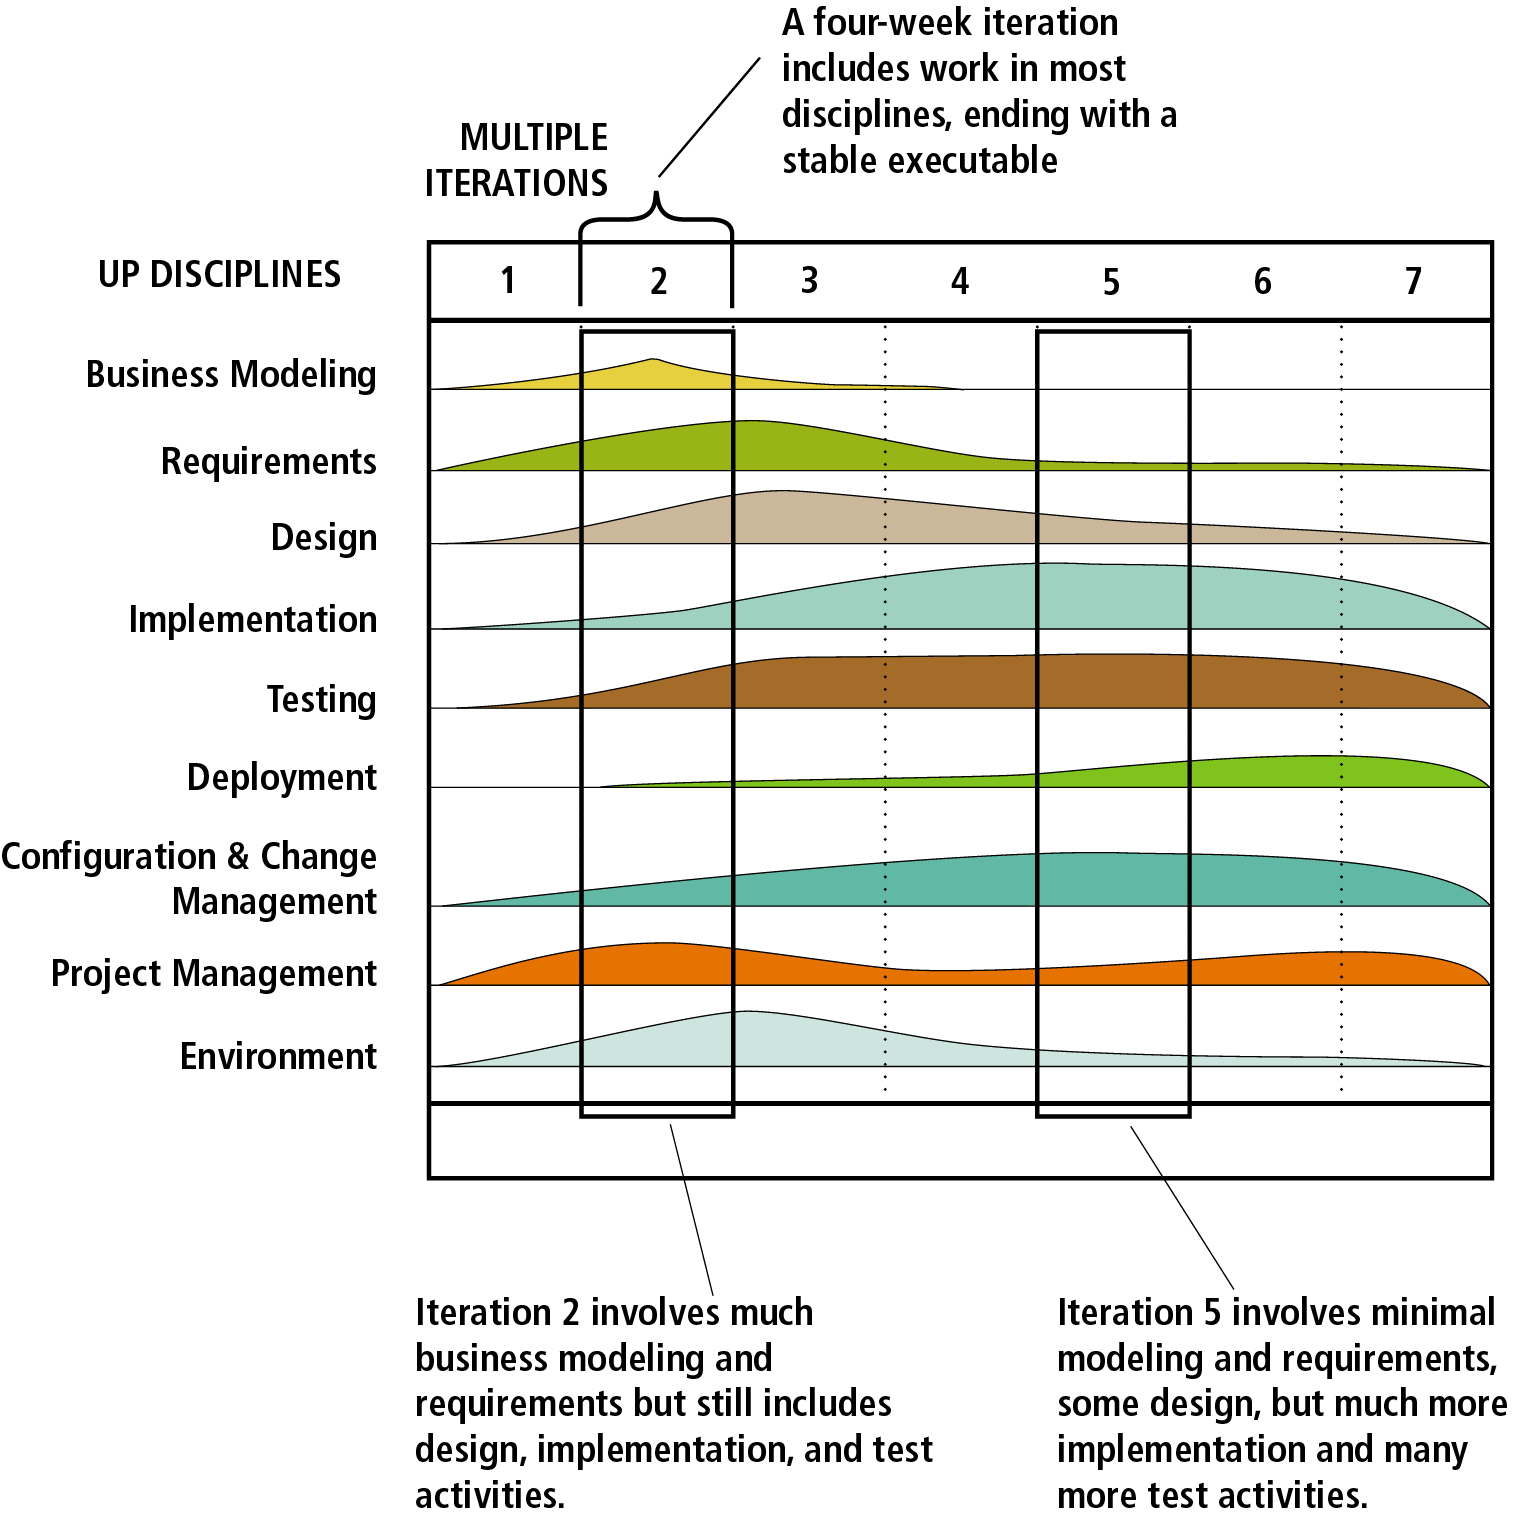
Unified Process Life Cycle Model
It shows that the Business Modeling (needed for the start of gathering the requirements) ends soon after the end of the Elaboration phase, while updating the Requirements does not end until the project ends. The Requirements document is one of the most important documents you have in your whole design. It should never be treated lightly. A short example of a Requirements document is attached. It is based on Scott’s Requirements document, since it was the most complete, as well as the closest to the examples in the two texts we use in class.
Creating a Noun Table
What is a Noun/Noun Phrase Table? How do I use it?
A noun and noun phrase table is a list of all the nouns and noun phrases found in the Requirements Document and other documents used to describe what needs to be accomplished in your project. Do not pare down this list. Look through the list carefully and look for synonyms and homonyms, then decide on a single noun that will be used to represent all of these works. Do not delete these nouns or noun phrases. List the synonyms under the main noun or noun phrase that represents the concept or item that the synonym also represents. With the homonyms, you need to find a different noun or noun phrase to represent the new concept or item. Make sure the new noun/noun phrase is something that everyone in the project can understand. Have a definition associated with each noun and noun phrase that helps you understand how the item is actually used. In the end, you need to identify how each noun/noun phrase is used. You need to identify whether each item represents an object or Class or whether it represents an attribute. If it is an attribute, try to associate it with the appropriate Class. If there are any noun/noun phrases left over, list these at the bottom of the table. You may be surprised, but these noun/noun phrases may really be needed and you will discover how they are needed later in the process.
One example of a way to write the noun/noun phrase table is from Darrell and Shaun. It is a good start. I would suggest going through all your requirements documentation and make sure your do have all noun/noun phrases listed. Also, be sure to have definitions to go along with the noun/noun phrases.
Determining Event Types
For the Events report, I wasn’t really sure how to classify things like expiring certifications. These are flagged based on the state of the certification, but are found by temporal actions such as a monthly sweep of volunteers to look for those type of things. Should those be state or temporal?
Look at your statement carefully. The certificate expires at a particular time. The state does change, but you need to be flagged when it does. This means that the event is temporal. A state event does not have a specific time associated with it. For example, the clothing store may order more shirts when the quantity falls below a predetermined value. The store does not know when this will happen, just that new shirts need to be ordered when it does. Now if the store ordered new shirts every January for the spring and summer seasons, do you think this would be a temporal or state event?
Activity Diagrams
How do Activity Diagrams differ from good old-fashioned FORTRAN flowcharts?
There are a lot of similarities between the two. Many of the same symbols are used. Obviously, whoever did the actual design of the Activity Diagram format must have based in all the old FORTRAN flowcharting. If it weren’t for computers, I would find my old flowcharting stencils and use them for any design work. The main difference in the two is that the FORTRAN flowcharts were supposed to represent a procedural flow of the program. On the other hand, Activity Diagrams are supposed to represent an objects “flow” through the system. It is good to make this distinction. If this is done correctly, it does help when you are doing the actual object oriented development.
Database Issues
At the start of Chapter 10, it talks about changing out a database and replacing it with an Object-Oriented Database (OODB). Is this always good? Also, some of the examples for relational databases did not appear to be dividing the data in the same way as the OO analysis indicated they should be divided. Is this good?
I have some concerns about the New Capital Bank example given on page 293 of Satzinger(1). Hopefully there was more discussion about this decision that what is reported in the book. From my experience in software design and implementation. the more things you are changing, the more problems could occur. One of the reasons why OODBs have not taken off as well as they might is how well Tables in a Relational DB can be made to look like Objects and how well each row can be made to look like an object. The methods are limited to initialize, store, retrieve, and delete. If these are the building blocks you need, then a relational DB may be all you really need. A common mistake of new analysts is to chose too grandiose of development plan and then fail because time ran out.
Be sure to review Normalization. In the text book, in Chapter 10, it mentions three normal forms. There are more, but many DB designers just use these three. Please see a Database text book if you want more information on normal forms. On the examples on pages 298-299, do you see anything that is common to both examples that might be put into a separate table or Class? Look carefully, if you have the same information typed into multiple tables, the likelihood of an error increases tremendously. Also, please use double primary keys sparingly. Double primary keys are a little harder to reference, if you are not allowing the system to take care of it automatically.
Implementation Model vs. Workflow Diagrams
I am confused about what is required for the Implementation Workflow. I have read chapter 23 in the soft-cover book several times now, and I still don’t know what is expected. Should I create a diagram like the one on page 478 (Arlow/Neustadt)? Or maybe like the one on page 479? Or is this just a text document?
The diagram on page 478 (Figure 23-4) is a Implementation Model Diagram. It derives from your Design Model Diagram and is probably the most useful of the two diagrams. The Implementation Workflow Diagram on page 479 (Figure 23-5) is like a pictorial view of the schedule. The IWD can be very useful in determining how the system should be developed. Both can be very useful diagrams, but you need to decided which of these diagrams (or both) will help you with your eventual development tasks.
Links, Dependencies, Binary Association
When should I use links, dependencies, binary association ??? Please explain the difference between these.
Both these diagrams describe relationships of physical merchandize to entries in a report.
Customer Return Diagram
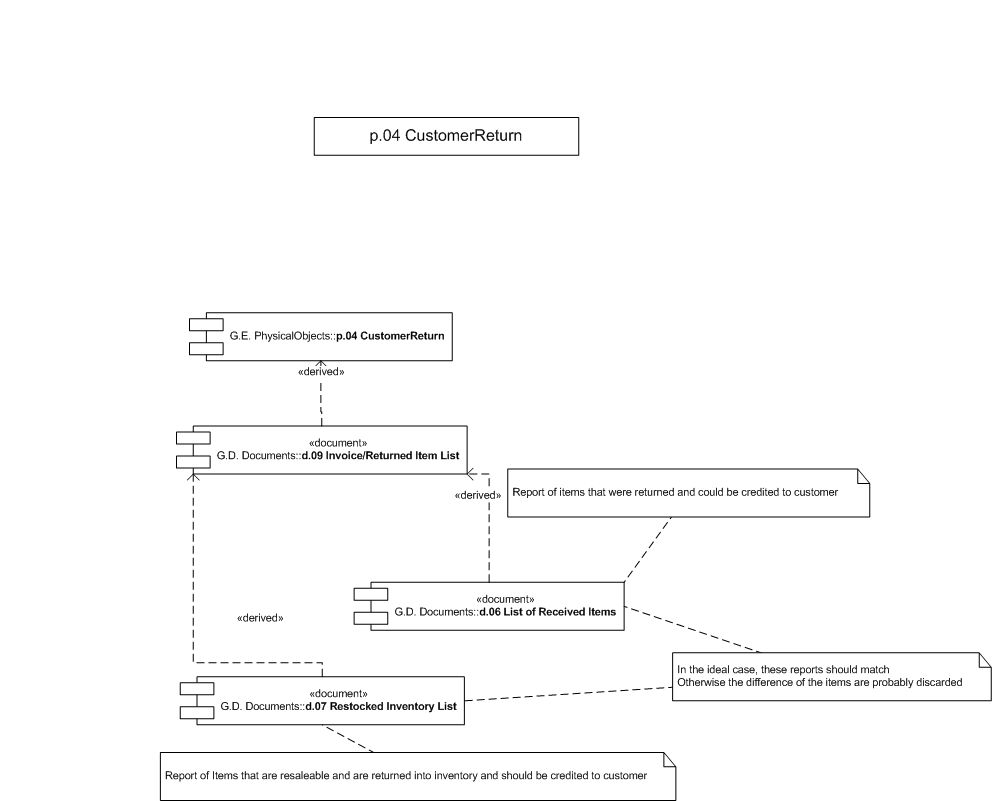
What steps need to be taken when a customer returns an item?
Incoming Mail Diagram
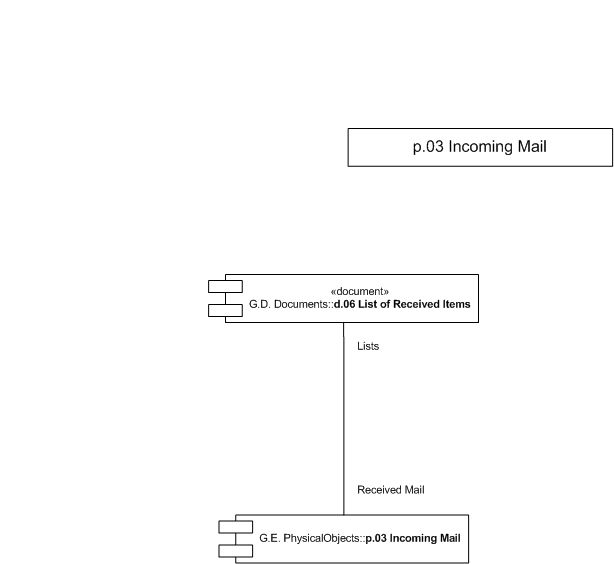
A simplified diagram of an incoming mail item.
Answer
This would be a good area for class discussion. The definition of a link on page 177 of Arlow/Neustadt is “A link is a semantic connection between two objects that allows messages to be sent from one object to the other.” To me the link is the most general of all the type connections listed in the question. My understanding is that dependencies and associations are different types of links. A dependency is where modifications to the supplier class affect the client class. This means, as is also stated in Arlow/Neustadt on page 195, that the client “depends in some way on the supplier.” The supplier can be a parameter to one of the class’ methods. Table 9.2, on page 195 of Arlow/Neustadt, the major classifications of dependencies with this dependencies defined even further starting on page 196. Associations are normally divided between aggregations and components, neither of which indicate a true supplier/client dependencies. It depends on how something is set up to determine whether the two objects form a dependency relationship or an association relationship. I would like to discuss an association of a car with four tire objects. Is this an association or a dependency? How would you implement it? If a Person object has an Attribute of Name, which is a class, and another attribute of Address, which is also a class; what is the relationship between these two groups. How would you implement it? From the verbiage of this paragraph, I think you can see which way I would implement these. If you can justify the method you used, then I will accept the results.
As a sub-note, a binary association is one between two classes. Be careful of these. If it is truly a binary association, should the two classes really only be one.